Sensor Status Screen
Purpose
Provide an overview of the selected sensor's operational status, hardware condition, and diagnostic information.
Description
The Sensor Status Screen provides operational summaries, system log records, activity visualizations, hardware diagnostics, and performance testing tools to support sensor monitoring, troubleshooting, and system validation.
Access
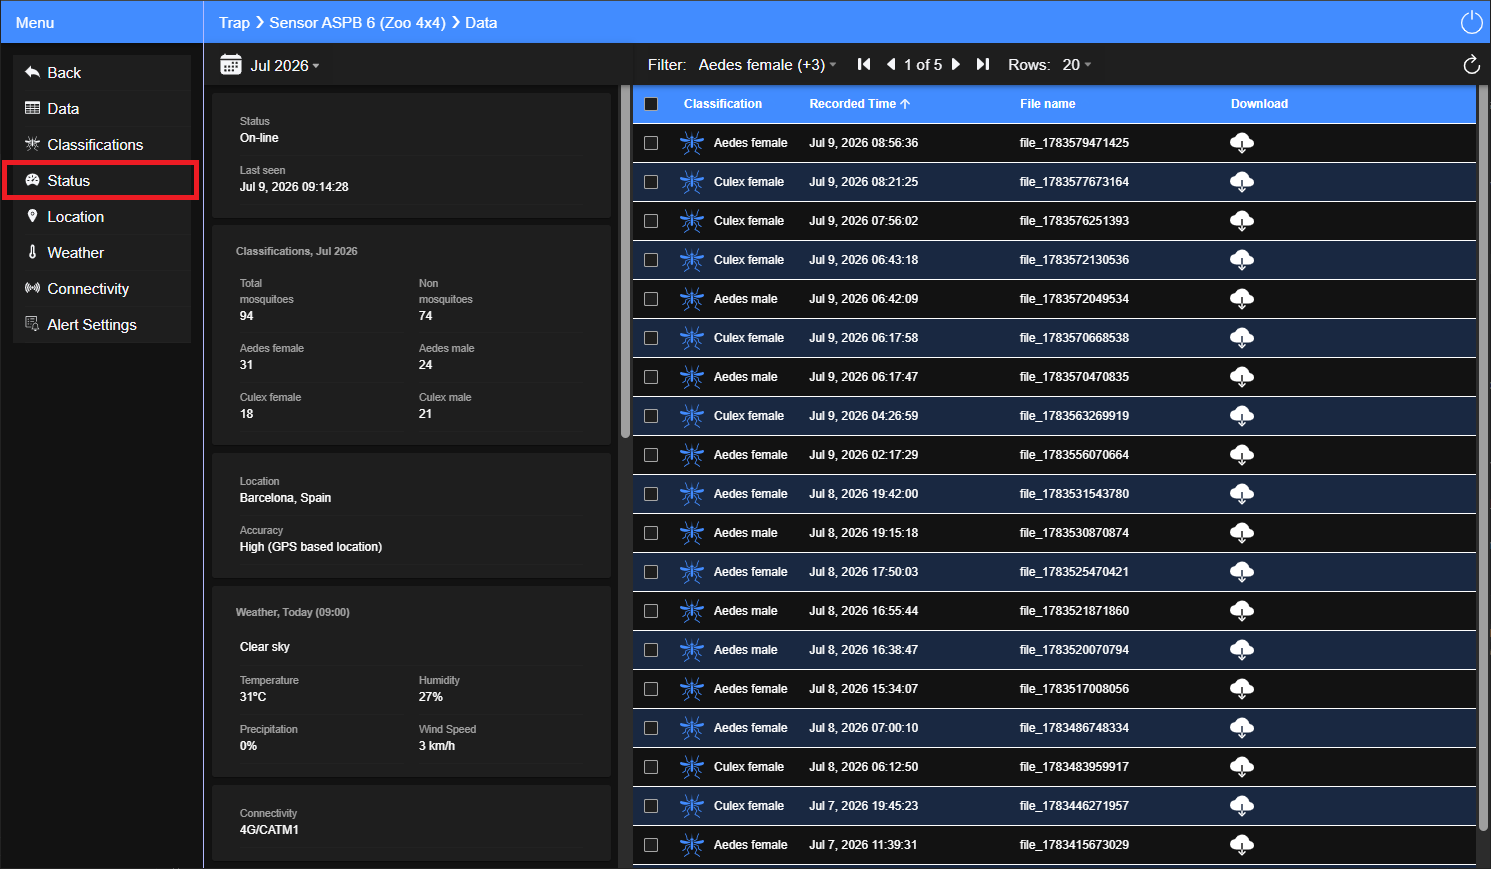
From the Sensor Data Screen, select Status from the Main Menu.
Main Components
- Summary Panel: Located on the left-hand side of the screen, this panel provides an overview of the selected sensor, including operational performance, recording statistics, hardware status metrics, and active warnings.
- Main Menu:
- System Log: Displays a chronological table of sensor system records, including operational intervals, uptime, firmware version, network type, GPS / Cell-ID availability, and warning codes.
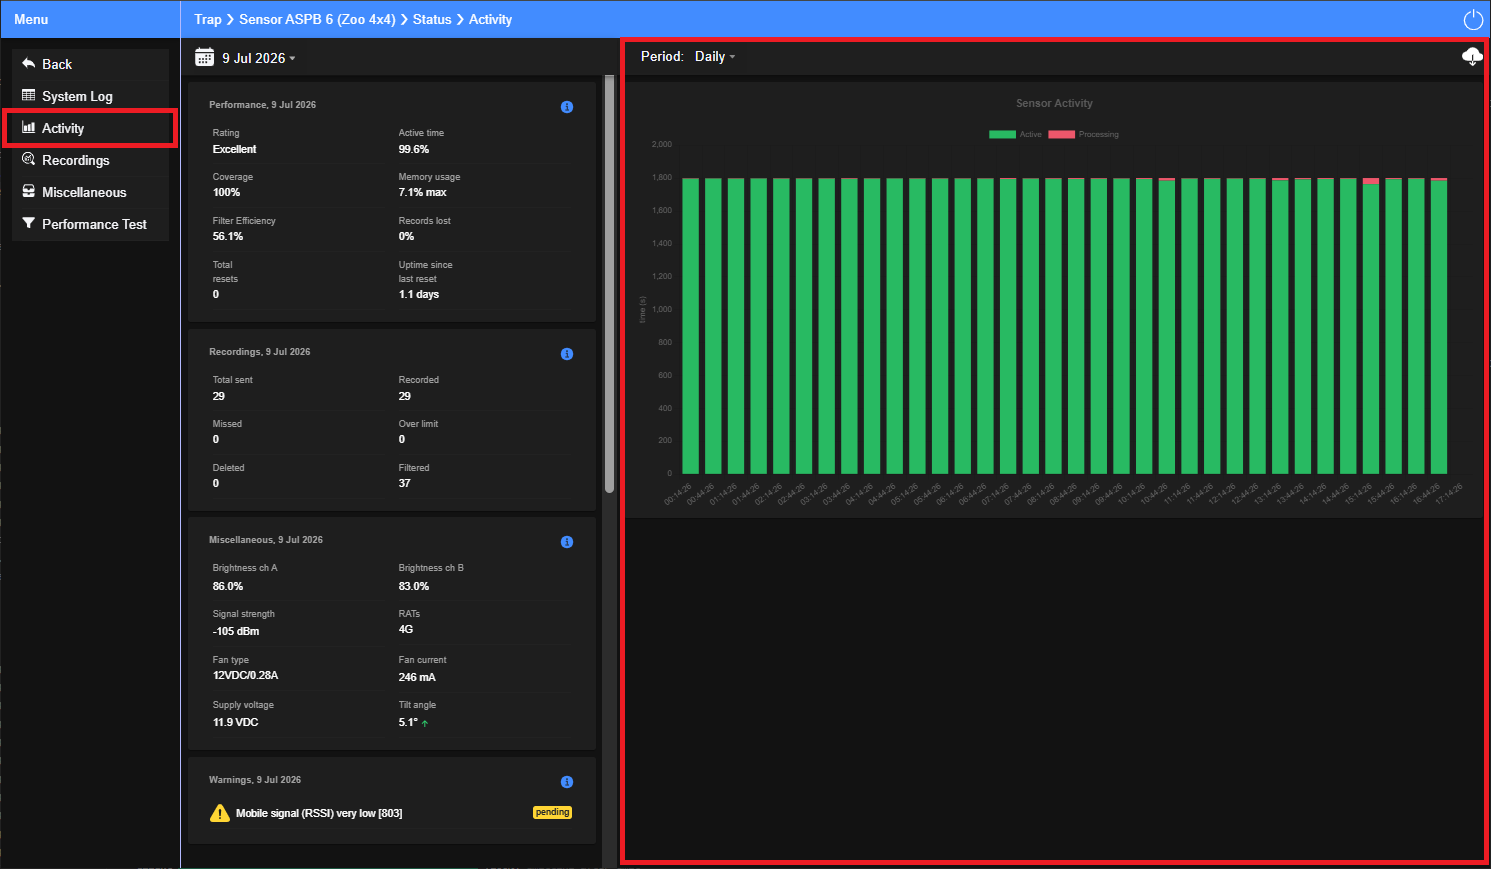
- Activity: Displays a bar chart showing the sensor's availability for mosquito event detection in 30-minute intervals throughout the selected reporting period.
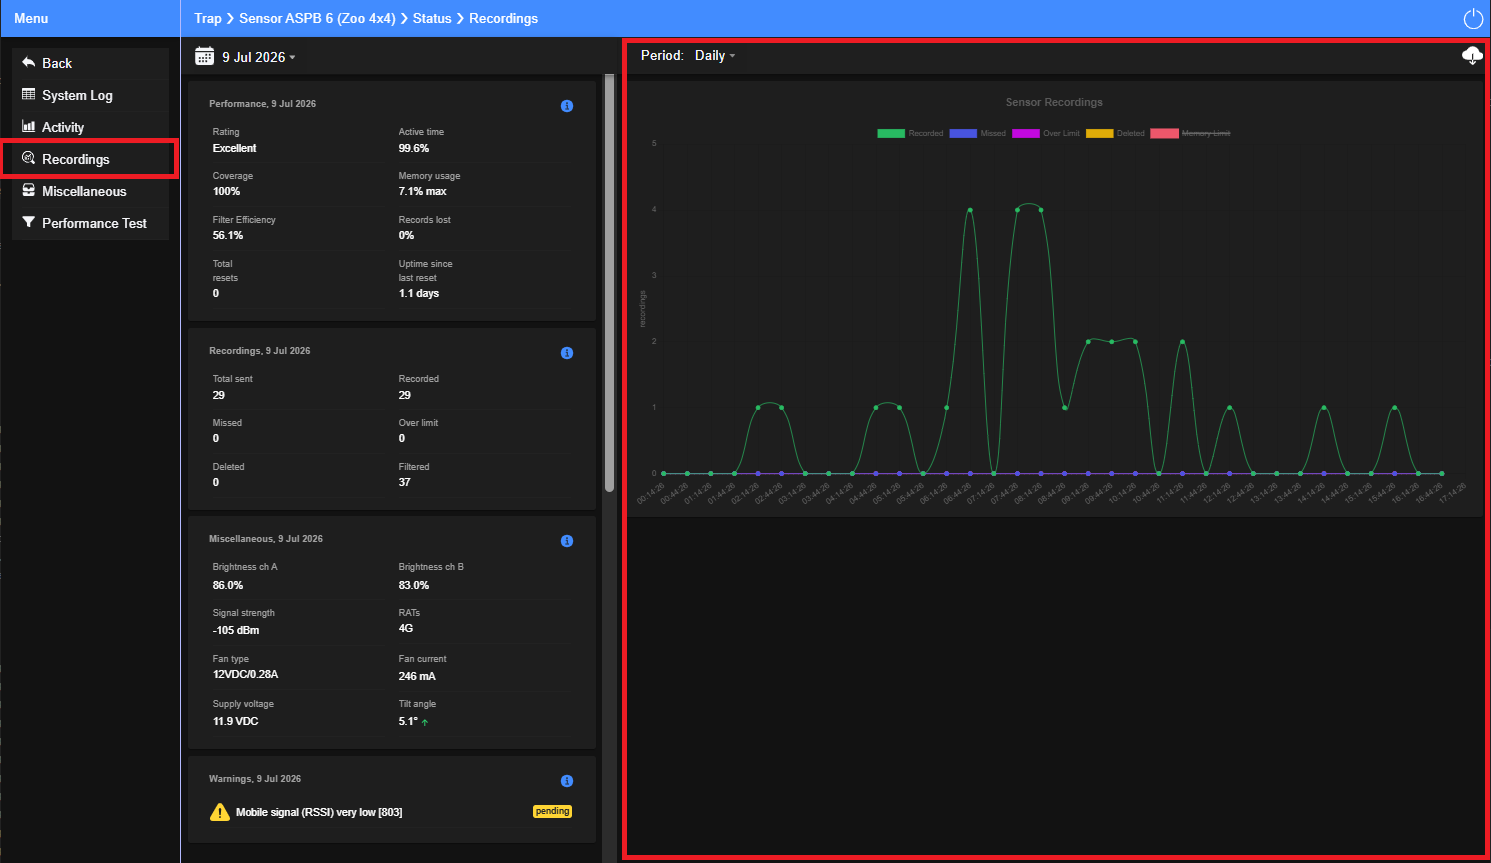
- Recordings: Displays time-series graphs summarizing recording outcomes, including transmitted, stored, missed, deleted, filtered, and recordings that could not be stored due to memory capacity limits.
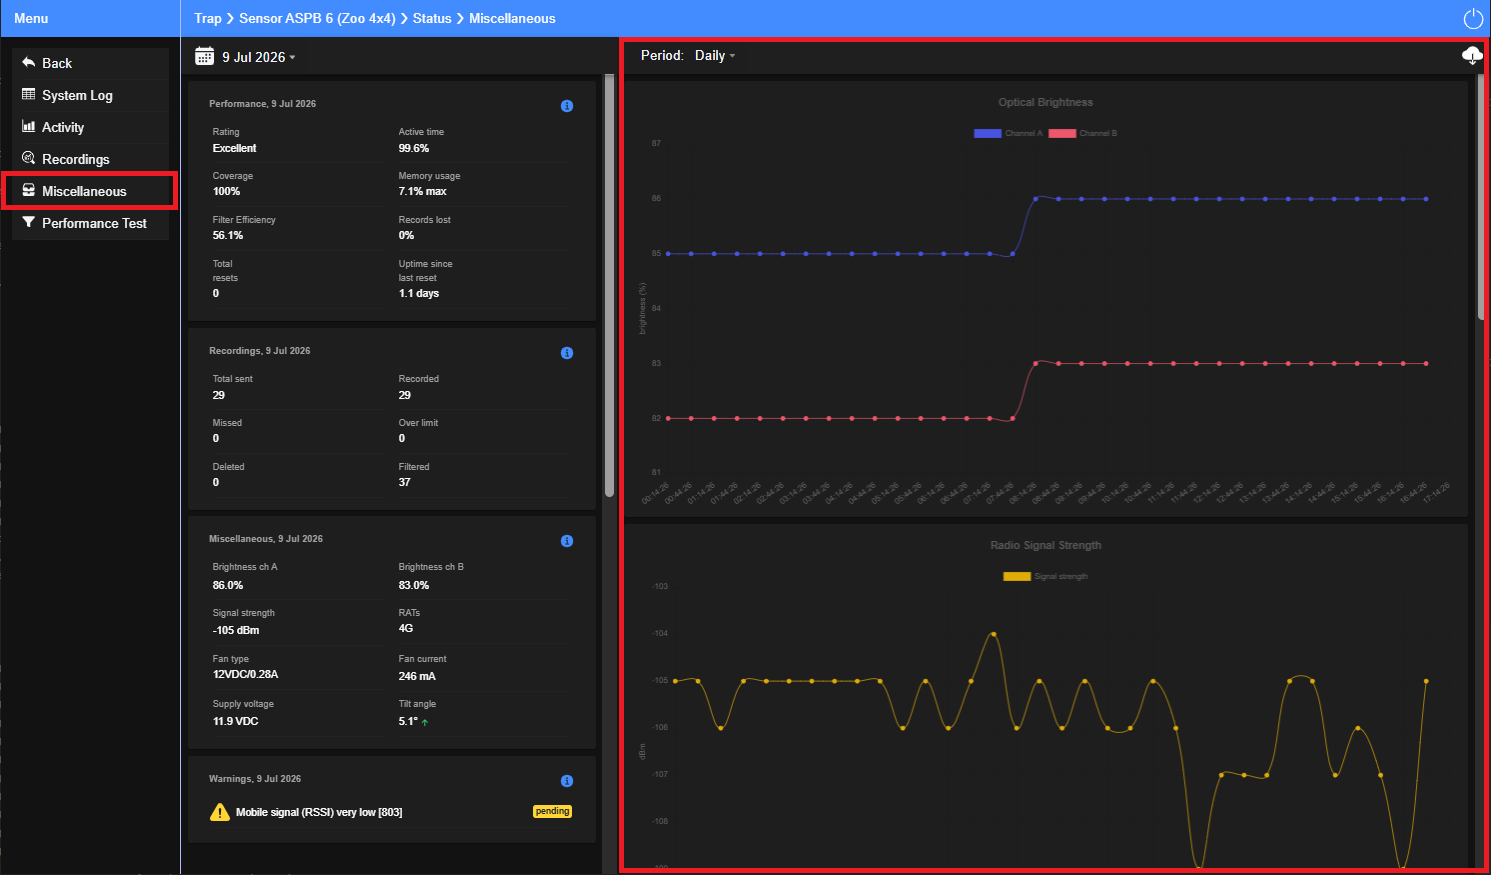
- Miscellaneous: Displays time-series graphs of hardware metrics, communication parameters, and other internal sensor measurements.
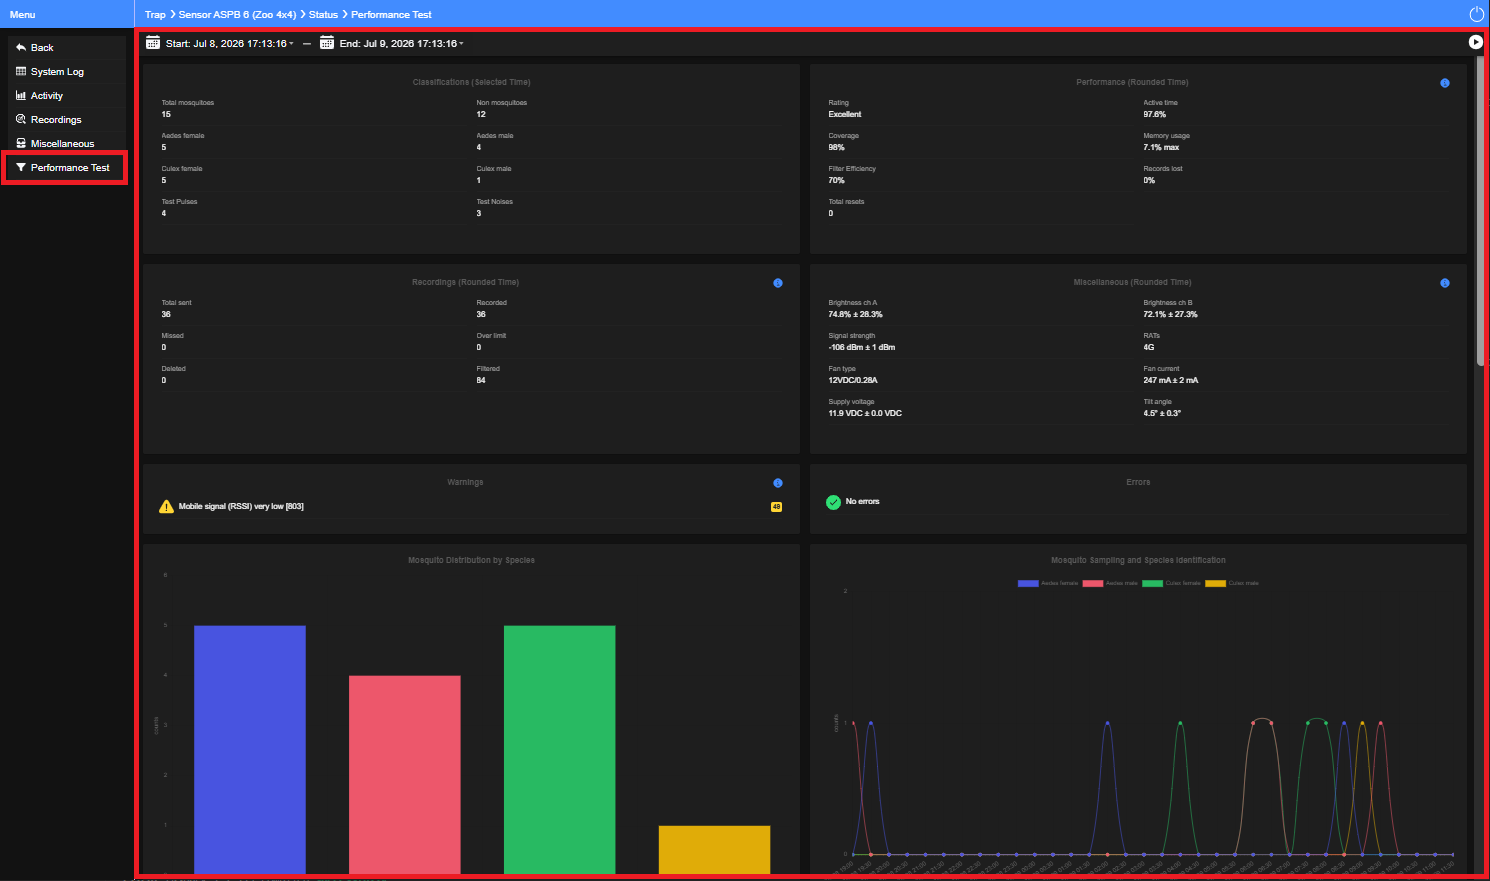
- Performance Test: Allows users to execute comprehensive remote diagnostic tests over a user-defined reporting period to evaluate mosquito capture activity, sensor performance, hardware condition, and overall sensor health.
Summary Panel
Purpose
Provide a consolidated overview of the selected sensor's operational status, recording statistics, hardware condition, and active warnings.
Description
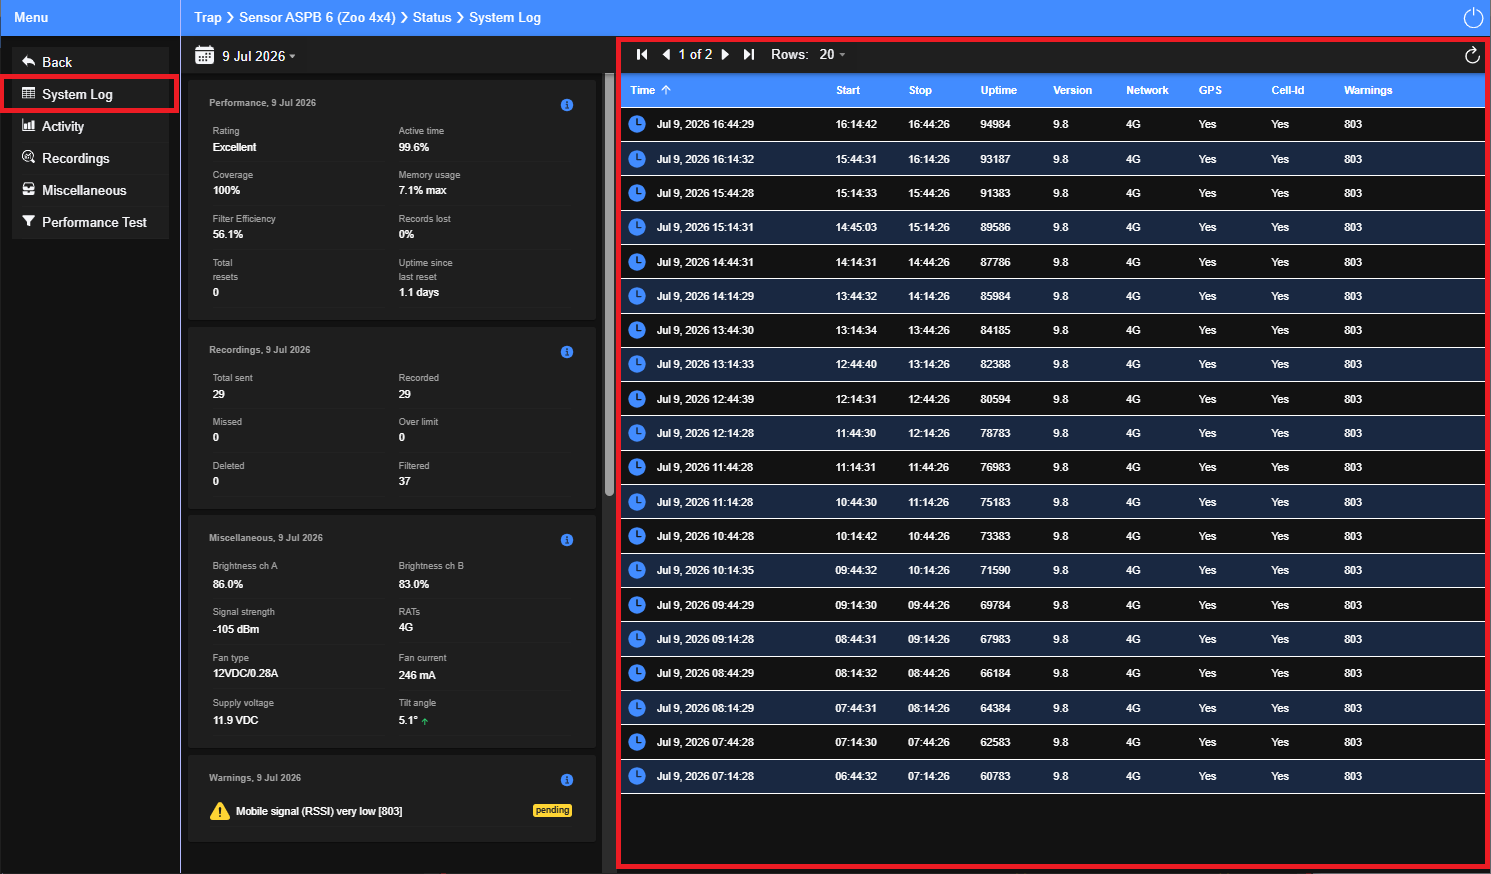
The Summary Panel is located on the left-hand side of the Sensor Status Screen and summarizes the most relevant operational and diagnostic information for the selected sensor. It enables users to quickly assess sensor performance, recording statistics, hardware condition, and active warnings before accessing the detailed diagnostic panels.
Key Components
- Reporting Period: Allows users to select the reporting period using the calendar controls. Depending on the selected view, users can navigate between days or months.
- Performance Summary: Displays key operational indicators, including the overall health rating, active time percentage, filter efficiency, test coverage, memory usage, records lost, and uptime since the last reset.
- Recording Summary: Displays the total number of recordings processed during the selected reporting period, including transmitted, stored, missed, deleted, filtered, and recordings that could not be stored due to memory capacity limits.
- Miscellaneous Summary: Displays key hardware metrics, including optical cleanliness, mobile signal strength (RSSI), active Radio Access Technology (RAT), fan type and current consumption, input voltage, and sensor tilt angle.
- Warnings Summary: Displays active warnings and anomalies detected during the selected reporting period, such as optics requiring cleaning, low mobile signal, location accuracy issues, low input voltage, or hardware and sensor module faults.
When the selected reporting date is today, the Miscellaneous Summary displays the latest values reported by the sensor. In this view, trend indicators identify values that are more than 5% above or 5% below the average for the selected reporting period.
For any other reporting date, the Miscellaneous Summary displays the average value of each metric for the selected reporting period.
For a detailed explanation of the metrics and status indicators displayed in each section, click the  button in the upper-right corner of the corresponding panel.
System Log Panel
Purpose
Provide access to chronological sensor system records and diagnostic information for the selected sensor.
Description
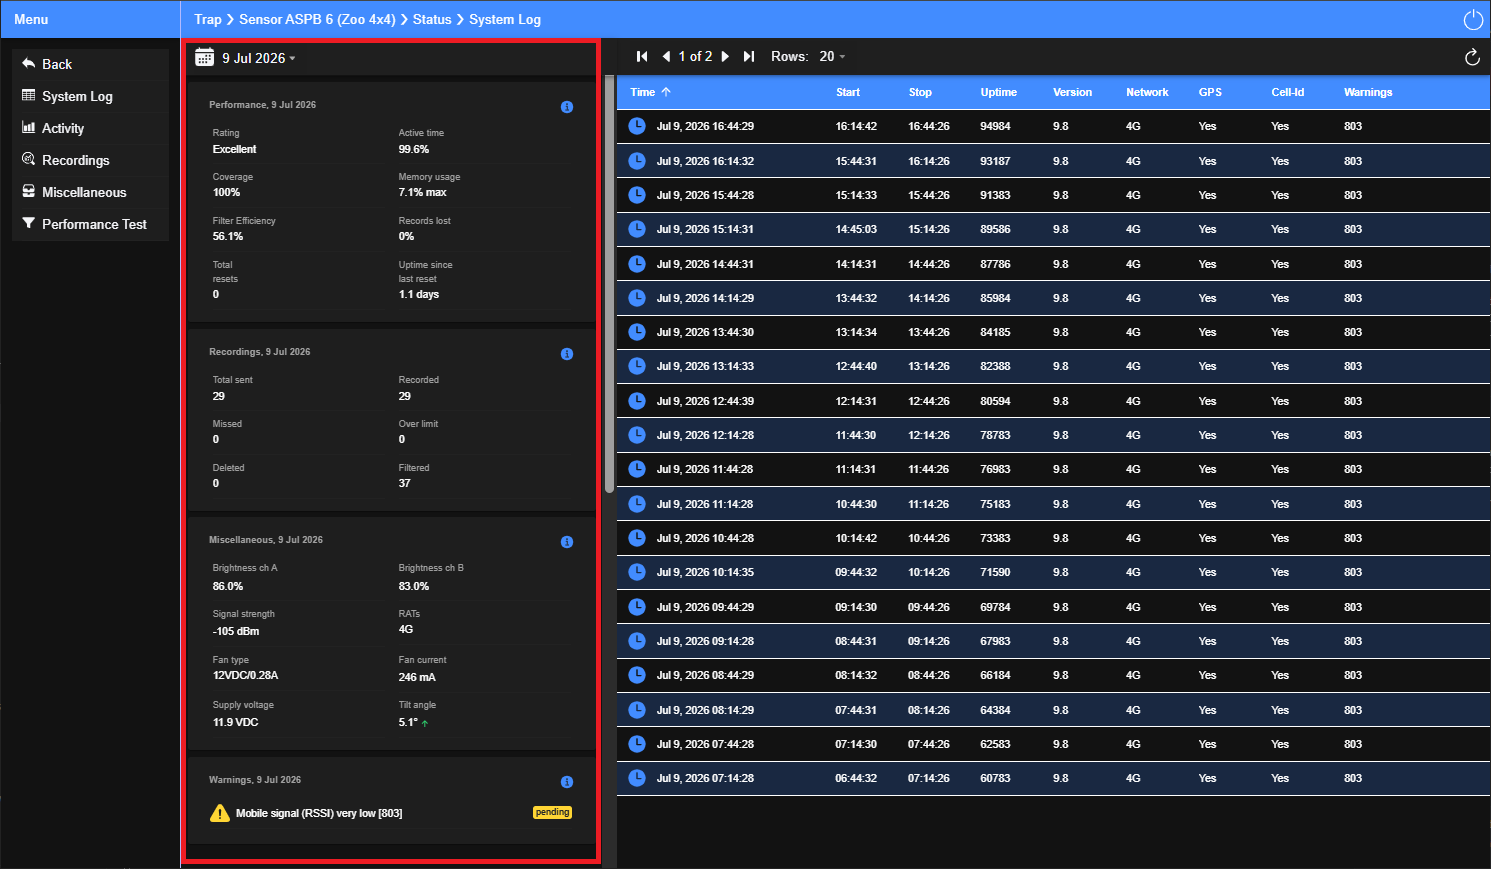
The System Log Panel displays a detailed table of time-stamped system records generated by the selected sensor. Users can review operational intervals, system parameters, connectivity status, and warning codes to support technical auditing, troubleshooting, and system validation.
Access
From the Sensor Status Screen, select System Log from the Main Menu.
Key Components
- System Log Table: Lists each sensor system record together with its timestamp and associated information. Each record includes:
- Start and Stop Time: Defines the operational interval associated with the record.
- Uptime: Displays the accumulated operating time recorded during the interval.
- Software Version: Displays the firmware version running on the sensor.
- Network: Displays the communication technology used by the sensor, such as 4G, 3G, 2G, or Wi-Fi.
- GPS / Cell-ID: Displays the availability status of the positioning methods, indicating whether a valid GPS or Cell-ID value was received (YES) or not available (NO).
- Warnings: Displays the warning codes generated by the sensor during the operational interval.
- Reporting Period: Displays sensor system records according to the selected reporting period using the calendar controls.
Hover over individual table cells in the System Log Table to display additional information related to the selected sensor system record.
Activity Panel
Purpose
Visualize the sensor's operational activity throughout the selected reporting period.
Description
The Activity Panel displays the sensor's operating state as a bar chart divided into 30-minute intervals. Depending on the selected reporting period, the panel displays activity for a single day or the entire month, allowing users to verify sensor availability for mosquito event detection and identify periods when event recording is temporarily suspended.
Access
From the Sensor Status Screen, select Activity from the Main Menu.
Key Components
- Activity Chart: Displays a bar chart representing the sensor's operating state in 30-minute intervals throughout the selected reporting period.
- Activity Status: Each bar represents the sensor's operating state:
- Green: Sensor available to detect and record mosquito events.
- Red: Sensor temporarily unavailable for event detection while processing data or performing internal operations.
- Panel Controls: Allow users to:
- Select the reporting period (Daily or Monthly).
- Select the displayed date or month using the calendar controls. When Monthly is selected, the calendar allows users to select a month instead of an individual day.
- Download the displayed activity data.
If no bar is displayed for a time interval, no activity status was received because the sensor was either offline or unable to transmit data to the server during that period.
Recordings Panel
Purpose
Visualize recording activity and outcomes throughout the selected reporting period.
Description
The Recordings Panel displays time-series graphs summarizing recording outcomes, allowing users to evaluate data collection performance and identify potential issues affecting event capture, data processing, storage, or transmission.
Access
From the Sensor Status Screen, select Recordings from the Main Menu.
Key Components
- Recording Charts: Displays graphical summaries of recording outcomes, including:
- Transmitted: Recordings successfully sent to the server.
- Stored: Recordings saved locally on the sensor.
- Missed: Events not recorded because the sensor was not available for event detection.
- Deleted: Recordings removed after unsuccessful transmission attempts due to communication issues.
- Filtered: Recordings discarded by the filtering process.
- Memory Limit: Recordings that could not be stored because the available sensor memory capacity was exceeded.
- Panel Controls: Allow users to:
- Select the reporting period (Daily or Monthly).
- Select the displayed date or month using the calendar controls. When Monthly is selected, the calendar allows users to select a month instead of an individual day.
- Download the displayed recording data.
Recording categories provide insight into the sensor's data collection process and help identify potential issues affecting event capture, data processing, storage capacity, or communication with the server.
Miscellaneous Panel
Purpose
Visualize hardware diagnostics, communication parameters, and internal sensor metrics throughout the selected reporting period.
Description
The Miscellaneous Panel displays time-series graphs of hardware metrics, communication parameters, and internal sensor measurements, allowing users to evaluate the sensor's physical condition and identify potential hardware, power, or connectivity issues.
Access
From the Sensor Status Screen, select Miscellaneous from the Main Menu.
Key Components
- Optical Status: Displays optical brightness measurements from the internal optical channels, providing information about the condition of the optical system.
- Communication Status: Displays the mobile signal level (RSSI) in dBm and the active Radio Access Technology (RAT) to evaluate communication quality.
- Physical Metrics: Displays key hardware metrics, including input voltage, fan current consumption, and sensor tilt angle.
- Panel Controls: Allow users to:
- Select the reporting period (Daily or Monthly).
- Select the displayed date or month using the calendar controls. When Monthly is selected, the calendar allows users to select a month instead of an individual day.
- Download the displayed hardware data.
Hardware and communication metrics provide insight into the physical condition and connectivity status of the sensor, helping identify potential issues affecting optical performance, power supply, communication quality, or mechanical installation.
Performance Test Panel
Purpose
Evaluate mosquito capture activity and overall sensor performance over a user-defined reporting period through a comprehensive remote diagnostic.
Description
The Performance Test Panel allows users to execute an on-demand remote diagnostic of the selected sensor over a user-defined reporting period. The test primarily evaluates mosquito capture activity and sensor performance, while also analyzing recording statistics, hardware operation, communication quality, and overall sensor health to support troubleshooting, preventive maintenance, and system validation.
Access
From the Sensor Status Screen, select Performance Test from the Main Menu.
Key Components
- Test Period: Allows users to define the Start Date and End Date used for the diagnostic analysis.
- Run Test: Click the Play button to start the remote diagnostic using the selected reporting period.
- Mosquito Activity Analysis: Displays the total number of mosquito captures, species distribution, and time-series trends of capture activity throughout the selected reporting period.
- Performance Analysis: Displays key operational indicators, including the overall health rating, active time percentage, filter efficiency, test coverage, memory usage, records lost, and uptime since the last reset.
- Recording Analysis: Summarizes recording activity and data management metrics, including transmitted, stored, missed, deleted, filtered, and recordings that could not be stored because the available sensor memory capacity was exceeded.
- Hardware and Communication Analysis: Displays diagnostic information for hardware components and communication parameters, including optical cleanliness, mobile signal strength (RSSI), active Radio Access Technology (RAT), input voltage, fan current consumption, and sensor tilt angle.
- Warnings and Errors: Lists warnings, anomalies, and hardware faults detected during the selected reporting period.
The performance test analyzes historical sensor data over the selected reporting period. The maximum analysis period is 30 days. Depending on the selected reporting period, the diagnostic may take a few moments to complete.
To inspect chart data in more detail, hover over a chart, hold the Ctrl key, and use the mouse wheel to zoom in or out. While holding Ctrl, click and drag to pan the chart.