Sensor Data Screen
Purpose
Provide centralized access to sensor records, mosquito capture data, species analysis, environmental conditions, connectivity information, and device details for the current month.
Description
The Sensor Data Screen provides comprehensive information about the selected sensor for the current month, including capture records, mosquito species analysis, environmental conditions, connectivity status, and device information. It combines tabular data, graphical summaries, and geographic information to support operational monitoring, field validation, and mosquito surveillance. The screen also provides firmware and hardware versions together with the sensor serial number to support maintenance and device traceability.
Access
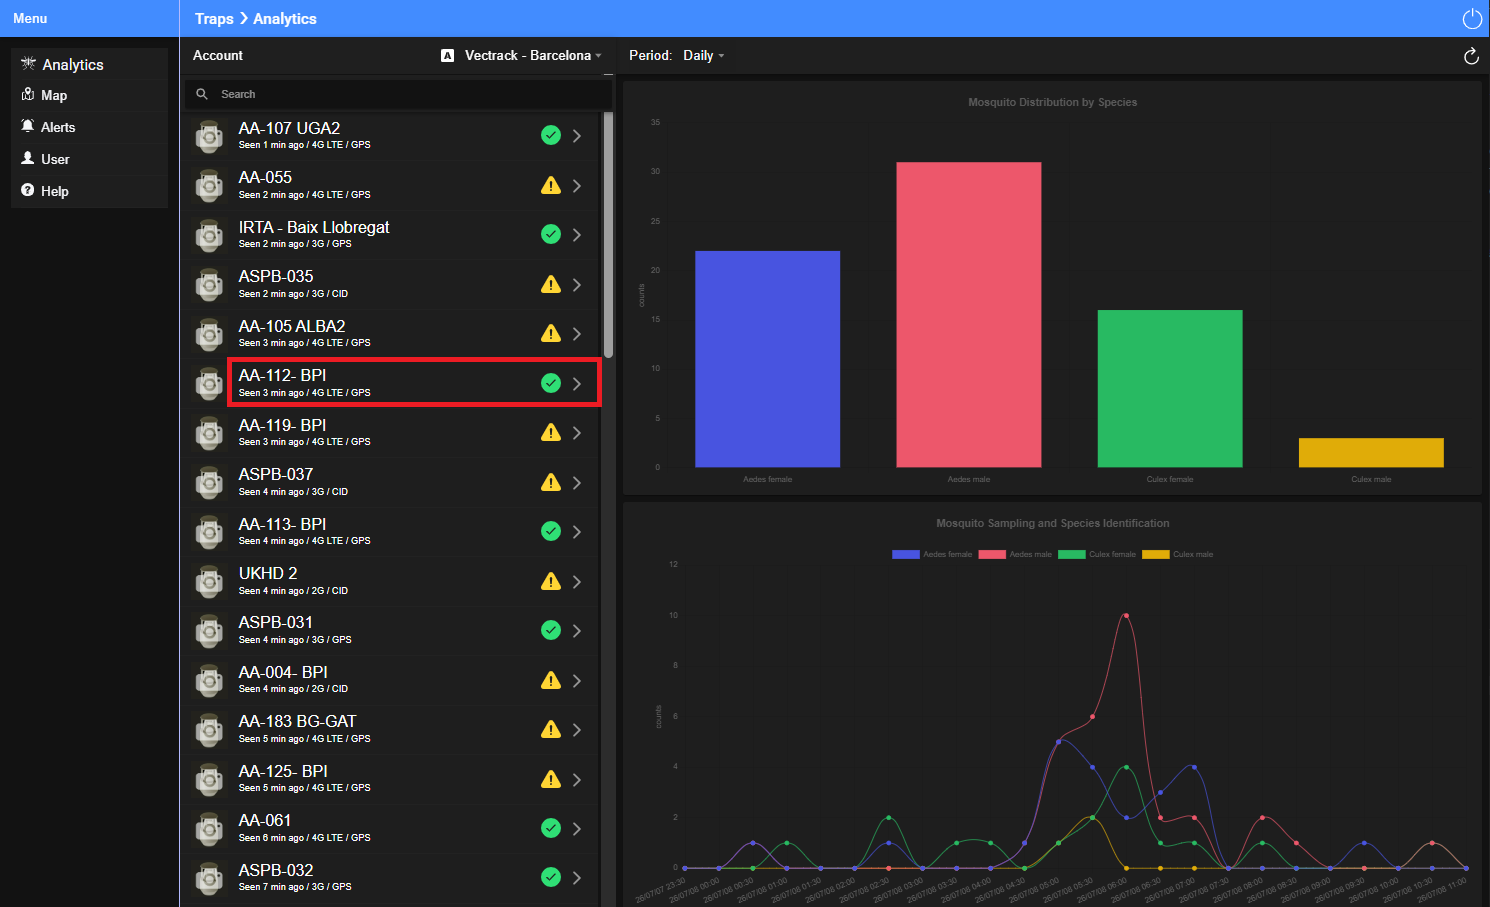
From the Overview Screen, single-click a sensor in the Sensor List to display its data.
Main Components
- Summary Panel: Located on the left-hand side of the screen, this panel provides a consolidated overview of the selected sensor by summarizing key information from all available menu options. Users can access more detailed information through the corresponding options in the main menu.
- Main Menu:
- Data: Displays a table containing all records generated by the selected sensor during the current month. Each record includes the capture date and time, the classification result, and, for mosquito detections, the option to download the associated capture metadata.
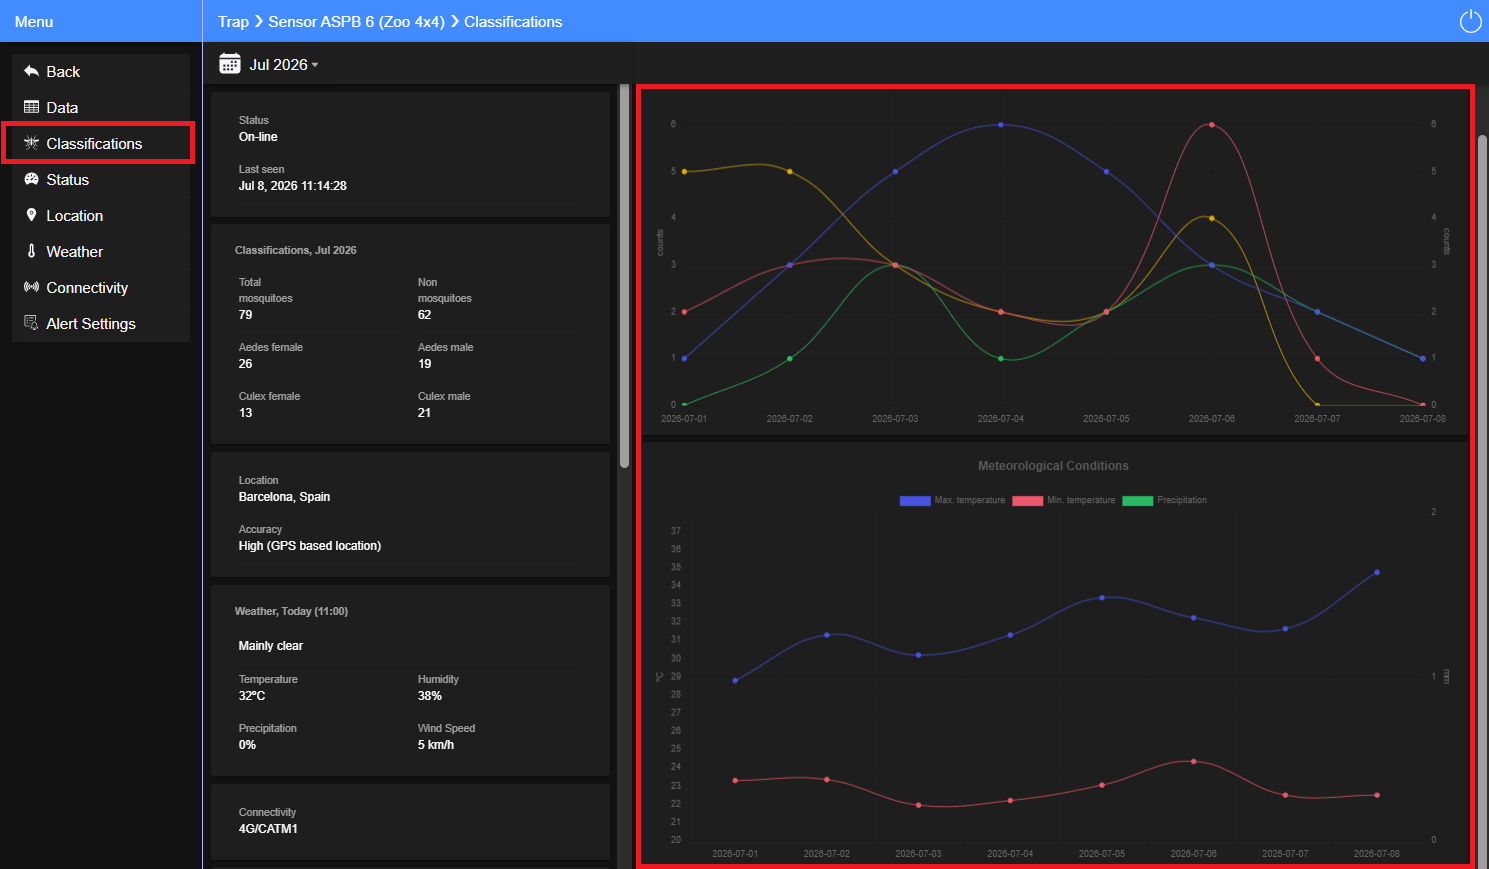
- Classification: Displays graphical summaries of capture classification results for the selected sensor during the current month. The panel includes a chart showing the total number of captures for each classification category and a timeline illustrating how capture classifications evolve throughout the month.
- Status: Provides access to the Status Screen, displaying operational, performance, and diagnostic information to support sensor monitoring and maintenance.
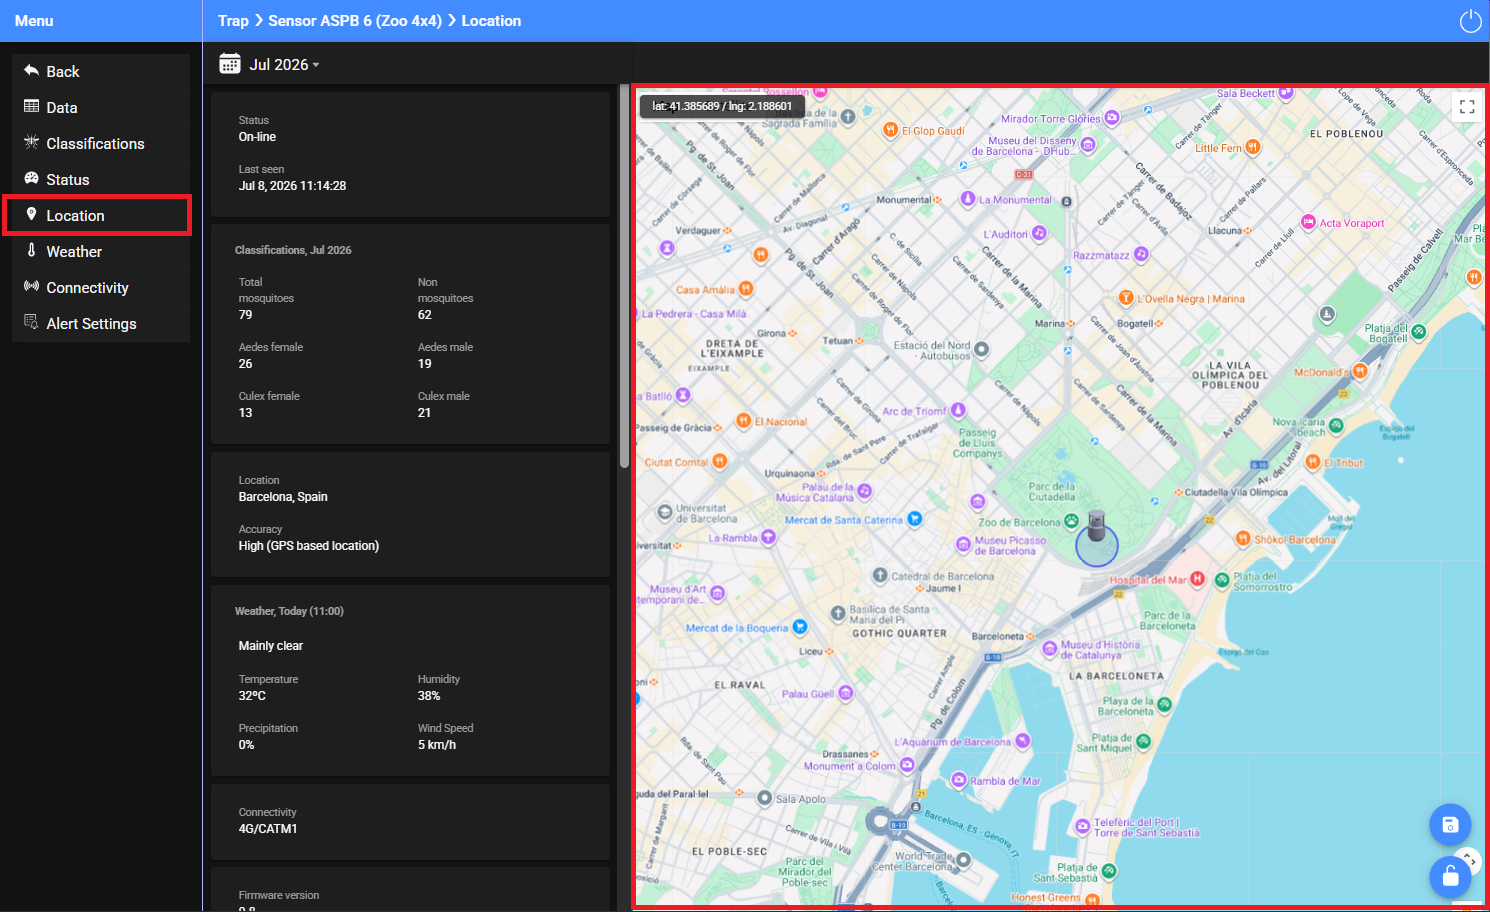
- Location: Displays the sensor location and deployment information to support field validation.
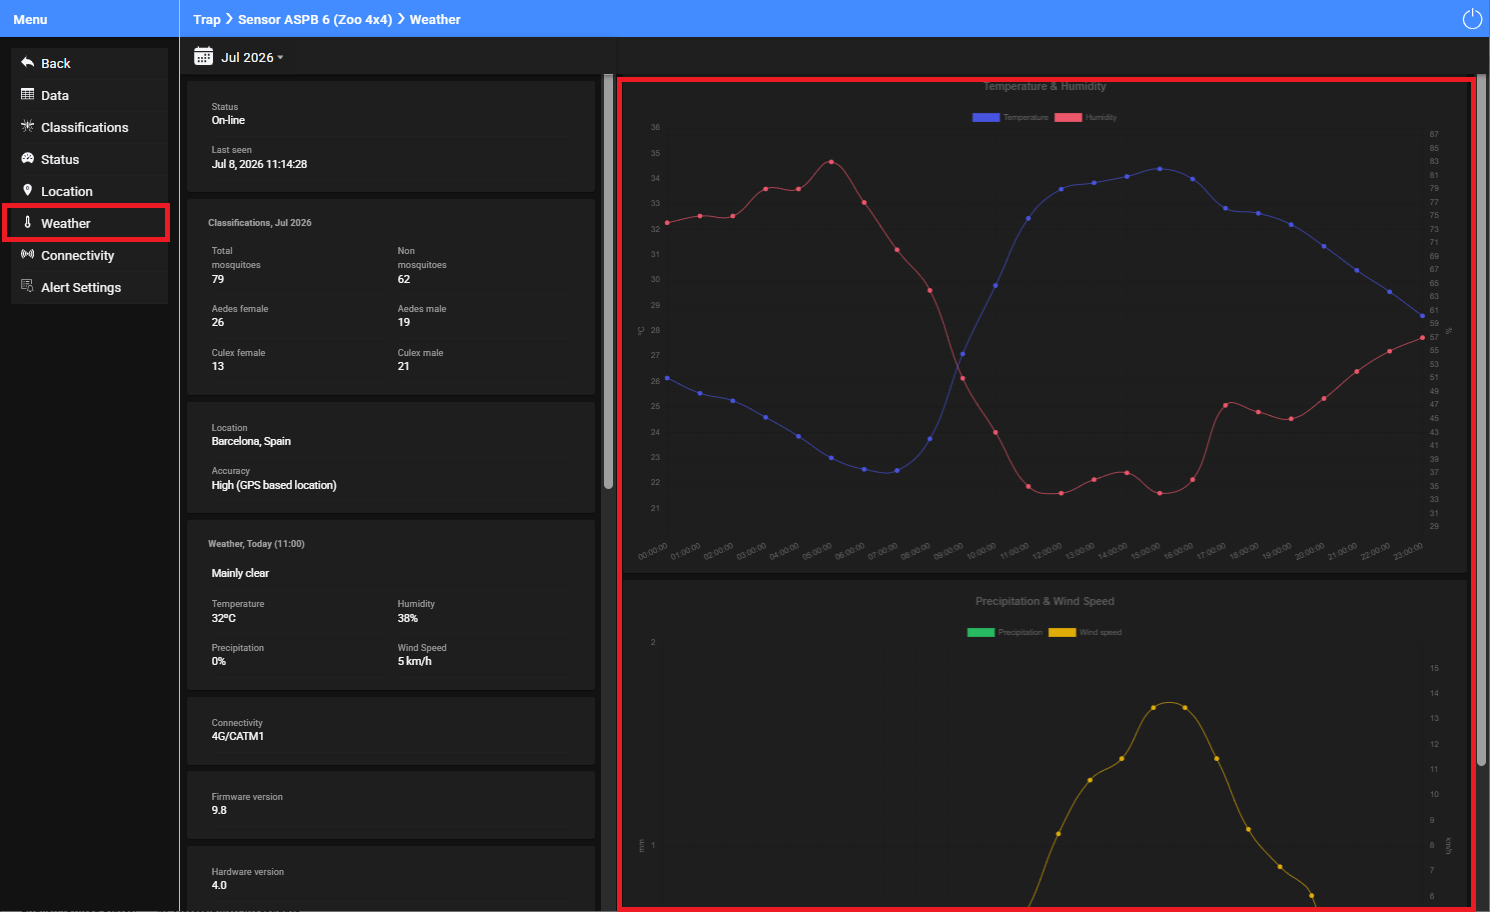
- Weather: Displays weather conditions recorded during the current month.
- Connectivity: Provides access to the Connectivity Screen, displaying mobile network information, SIM status, data usage, and SIM management functions for sensors equipped with a cellular connection.
- Alert Settings: Allows users to configure alert conditions and notification settings for the selected sensor.
Summary Panel
Purpose
Provide a consolidated overview of the selected sensor, including its operational status, monthly activity, environmental conditions, connectivity, and device information.
Description
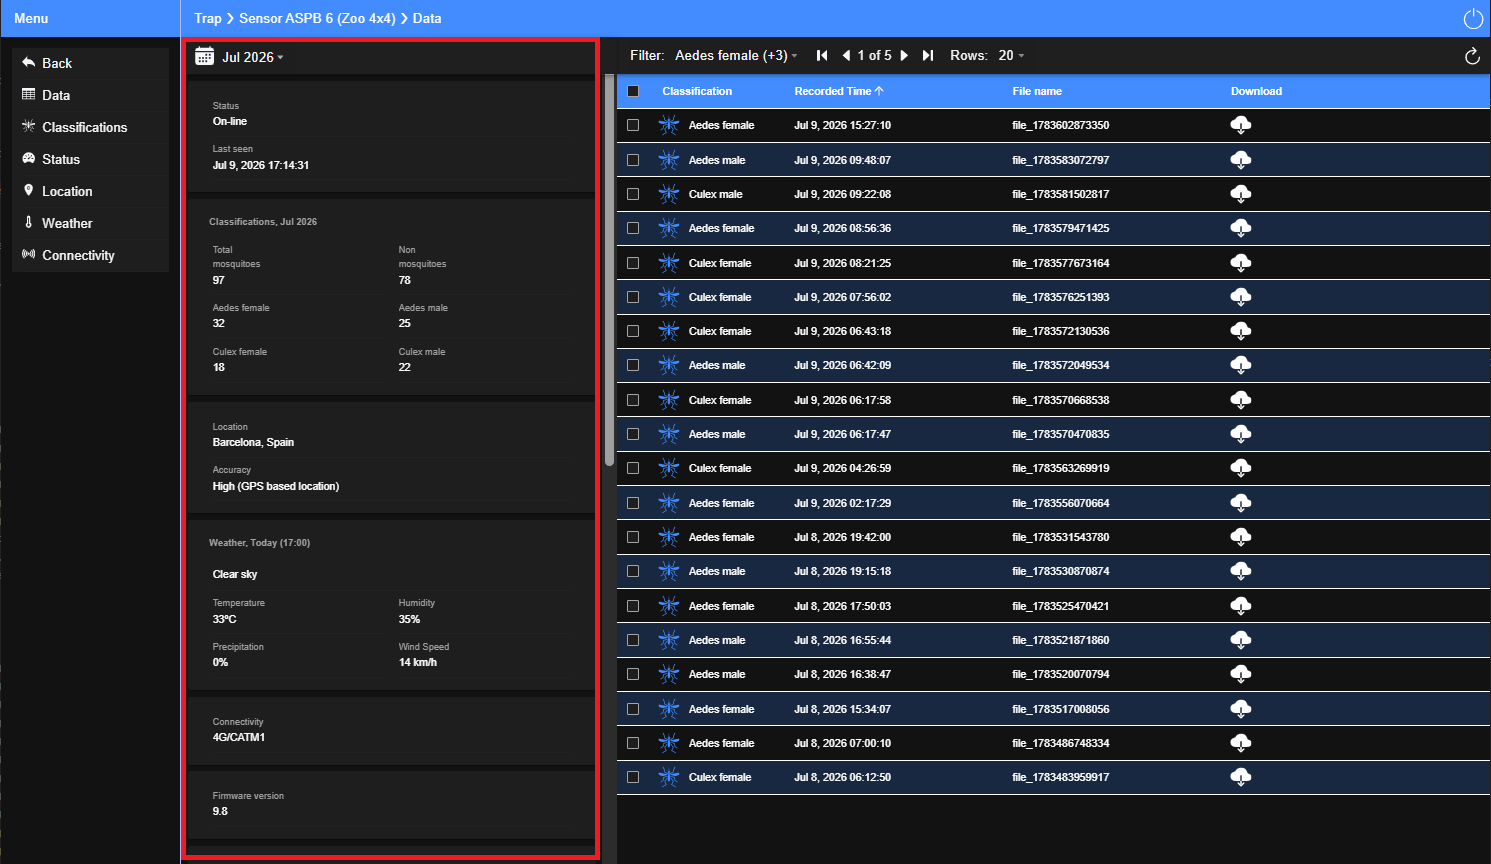
The Summary Panel is located on the left-hand side of the Sensor Data Screen and provides a summary of the most relevant information for the selected sensor for the selected month. It enables users to quickly assess sensor activity, operational status, environmental conditions, connectivity, and device information before accessing the individual information panels.
Key Components
- Reporting Period: Allows users to navigate between months using the calendar controls. All information displayed in the Sensor Data Screen is updated according to the selected reporting period.
- Connectivity Status: Displays the current operational status (ON/OFF) and the last communication time.
- Monthly Capture Summary: Displays the total number of mosquito captures recorded during the selected month, including a breakdown of captures by species.
- Location Information: Displays the sensor deployment location (for example, Barcelona) together with the estimated location accuracy (for example, High for GPS or Low for Cell ID).
- Current Weather Summary: Displays the current weather conditions at the sensor location.
- Connection Type: Displays the communication technology used by the sensor, such as 4G, 3G, 2G, or Wi-Fi.
- Device Information: Displays the firmware version, hardware version, and sensor serial number to support maintenance and device traceability.
Data Panel
Purpose
Provide access to individual capture records, classification results, and capture metadata for the selected sensor.
Description
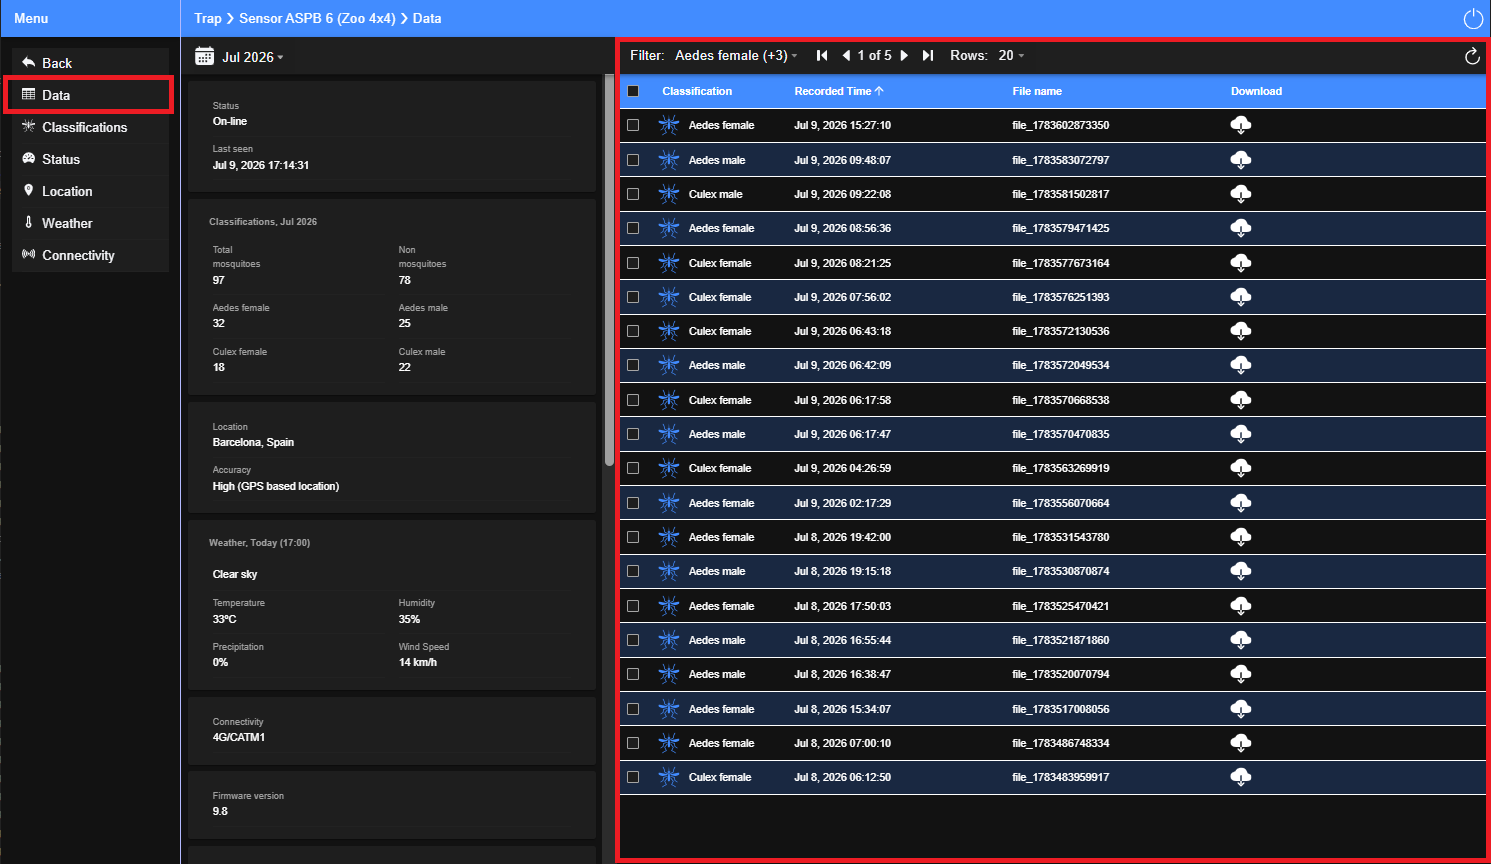
The Data Panel displays a detailed table of all capture events recorded by the selected sensor for the month selected in the Sensor Data Panel. Users can review individual events, filter records by classification, and download the associated capture metadata for auditing, validation, or further analysis.
Access
From the Sensor Data Screen, select Data from the main menu.
Key Components
- Event Table: Lists each capture event together with its Classification, Recorded Time, and File Name. Each row includes a download icon that allows users to download the metadata associated with an individual capture record. Rows can also be selected using the checkboxes to enable downloading multiple records at once.
- Reporting Period: Displays records for the month selected using the calendar controls in the Sensor Data Panel.
- Filter Options: Allow users to filter the displayed records by:
- Mosquito classifications (for example, Aedes female, Aedes male, Culex female, or Culex male).
- Diagnostic and non-target events (for example, Test Pulse, Test Noise, or Non-target Species).
- Download Selected Records: Select one or more records using the checkboxes in the Event Table. A download icon appears next to the Refresh button in the upper-right corner of the table, indicating the number of selected records. Click the icon to download the metadata associated with the selected mosquito capture events.
Classification Panel
Purpose
Visualize mosquito population trends and their relationship with environmental conditions for the selected month.
Description
The Classification Panel provides graphical summaries of mosquito capture classifications and environmental conditions recorded during the selected month. It allows users to analyze mosquito population trends and compare them with meteorological factors that may influence mosquito activity.
Access
From the Sensor Data Screen, select Classification from the main menu.
Key Components
- Mosquito Sampling Trends: The top graph displays mosquito capture trends for the selected month, showing the evolution of classified mosquito detections over time.
- Meteorological Conditions: The bottom graph displays environmental conditions for the selected month, including Temperature and Precipitation data.
Weather data is obtained from meteorological stations located near the location reported by the sensor and is used to provide environmental context for mosquito activity analysis.
Location Panel
Purpose
Confirm the sensor deployment location and analyze its geographical context.
Description
The Location Panel provides geographical information about the selected sensor, allowing users to validate its deployment position and assess the accuracy of the reported location.
Access
From the Sensor Data Screen, select Location from the main menu.
Key Components
- Sensor Position Map: Displays the sensor position on a high-resolution map to support field validation and deployment monitoring.
- Location Accuracy: The accuracy of the reported sensor position is represented by a circular area around the sensor marker on the map. A smaller circle indicates higher location accuracy, while a larger circle indicates lower accuracy.
- High: Location obtained from GPS coordinates, represented by a smaller accuracy circle.
- Low: Location estimated using Cell-ID information, represented by a larger accuracy circle.
- Sensor Position Update: Users assigned the Organization or Administrator role can modify the sensor deployment position using the map controls located in the lower-right corner of the panel:
- To enable position editing, first unlock the sensor by clicking the lock icon.
- When the sensor is unlocked, the current sensor coordinates are displayed in the upper-left corner of the map and are updated dynamically as the user moves the sensor marker to the desired location using the mouse controls.
- Save the new position by clicking the corresponding save icon (disk-shaped icon).
The location accuracy circle represents the estimated uncertainty range of the sensor position. The actual sensor location is expected to be within this area.
Position Display Priority: The map displays the sensor position based on the following order:
- GPS Position: When a GPS position is available, it is always displayed, even if the sensor position has been manually modified.
- Cell-ID Position: If no GPS position is available, the map uses the Cell-ID estimated position. If the server position falls within the accuracy area of the Cell-ID position, the server position is displayed instead.
- Server Position: If neither GPS nor Cell-ID information is available, the position stored on the server tionis displayed.
Weather Panel
Purpose
Visualize daily weather conditions recorded during the selected month.
Description
The Weather Panel displays daily weather information for the selected month, allowing users to review historical environmental conditions recorded for the sensor location.
Access
From the Sensor Data Screen, select Weather from the main menu.
Key Components
- Date Selection: Unlike the other panels, the Weather Panel allows users to select a specific day within the selected month using the calendar. Selecting a different day updates the displayed weather information accordingly.
- Temperature and Humidity: The top graph displays the daily Temperature and Relative Humidity values for the selected day.
- Precipitation and Wind Speed: The bottom graph displays the daily Precipitation and Wind Speed values for the selected day.
Weather data is obtained from meteorological stations located near the location reported by the sensor.
Alert Settings Panel
Purpose
Configure alert conditions and notification settings for the selected sensor.
Description
The Alert Settings Panel allows authorized users to configure hardware alert conditions for the selected sensor. Individual alert conditions can be enabled or disabled to control when notifications are generated.
Access
From the Sensor Data Screen, select Alert Settings from the main menu.
Key Components
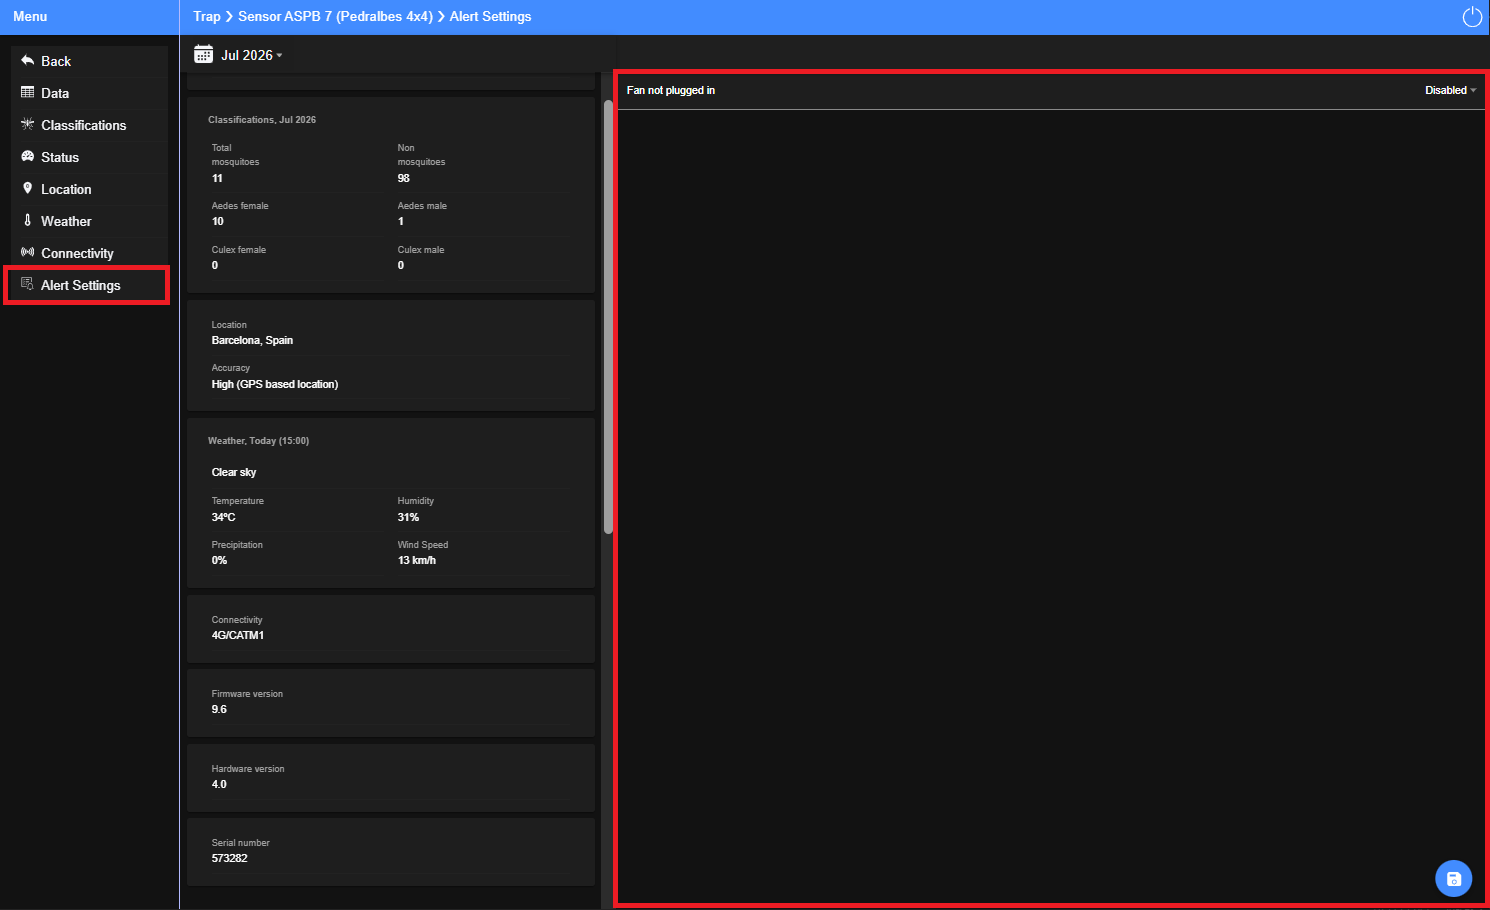
- Alert List: Displays all available hardware alert conditions (for example, Fan Not Plugged In).
- Alert Status: Each alert includes an Enabled/Disabled toggle that determines whether notifications are generated for that condition.
- Alert Configuration: Users assigned the Organization or Administrator role can enable or disable individual alert conditions and save the updated configuration by clicking the corresponding Save icon (disk-shaped icon).
Related Features
- Alerts Panel: Provides a centralized view of active and historical alerts through the Overview Screen.
- Telegram Notifications: Telegram notifications are managed through the User Screen. Alert notifications are delivered to users who have joined the Telegram group associated with the selected account.
Currently, notifications are available only for the Fan Not Plugged In alert.