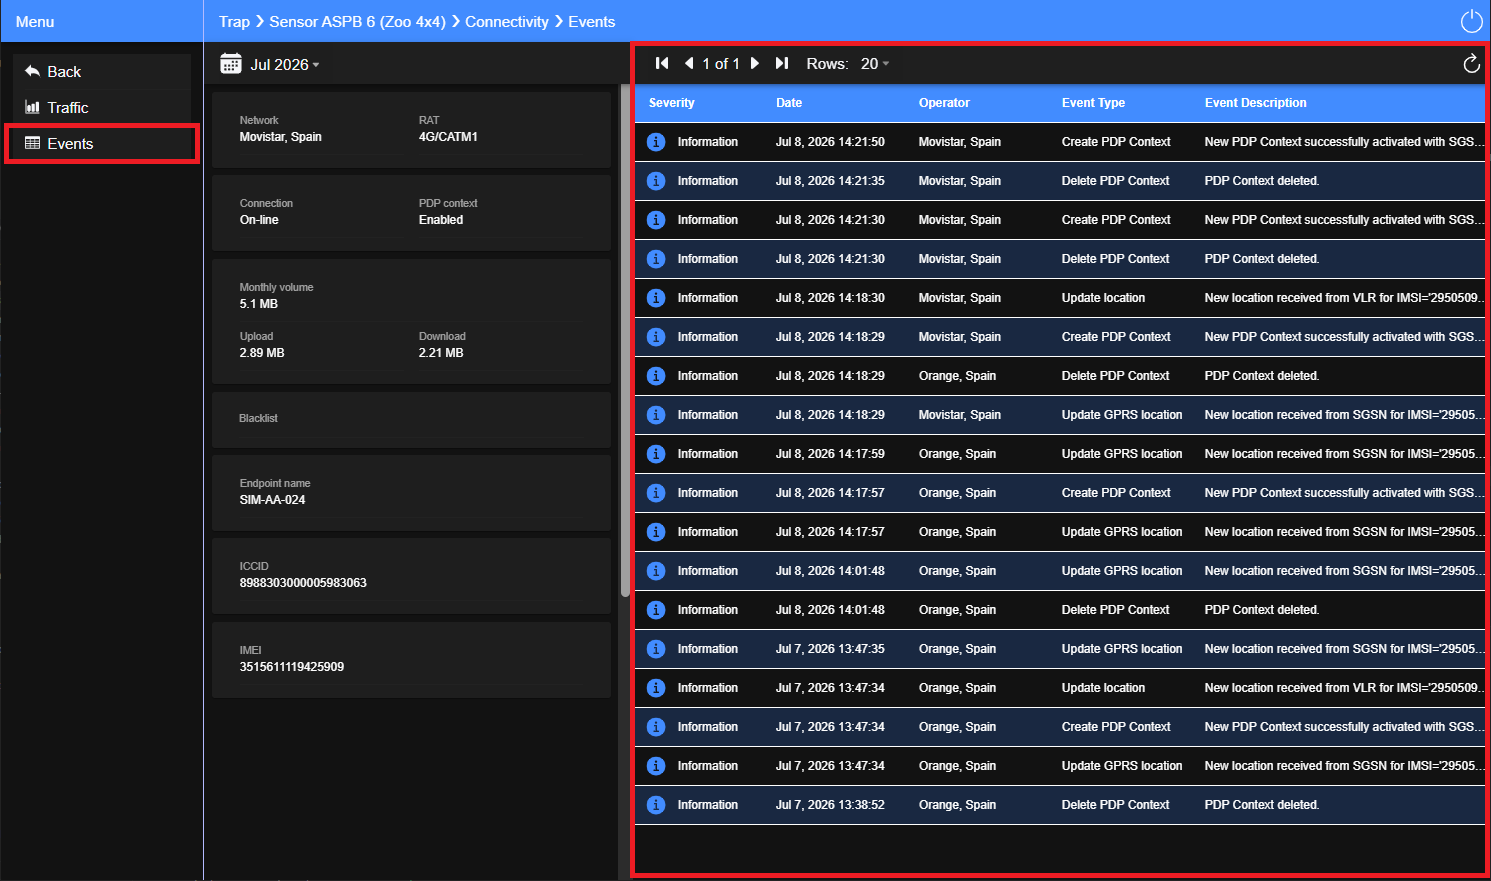
Connectivity Screen
Purpose
Provide access to the selected sensor's network connectivity information, mobile data usage, and connectivity events.
The Connectivity Screen is available only for sensors using an Irideon-managed SIM card. Sensors configured with customer-supplied SIM cards or Wi-Fi connectivity do not provide the network information, mobile data usage, and connectivity events required to populate this screen.
Description
The Connectivity Screen enables users to monitor the selected sensor's network connectivity, review monthly mobile data usage, and investigate communication events. It provides a high-level view of the sensor's connection status together with tools for analysing network traffic and troubleshooting connectivity issues.
Access
From the Sensor Data Screen, select Connectivity from the Main Menu.
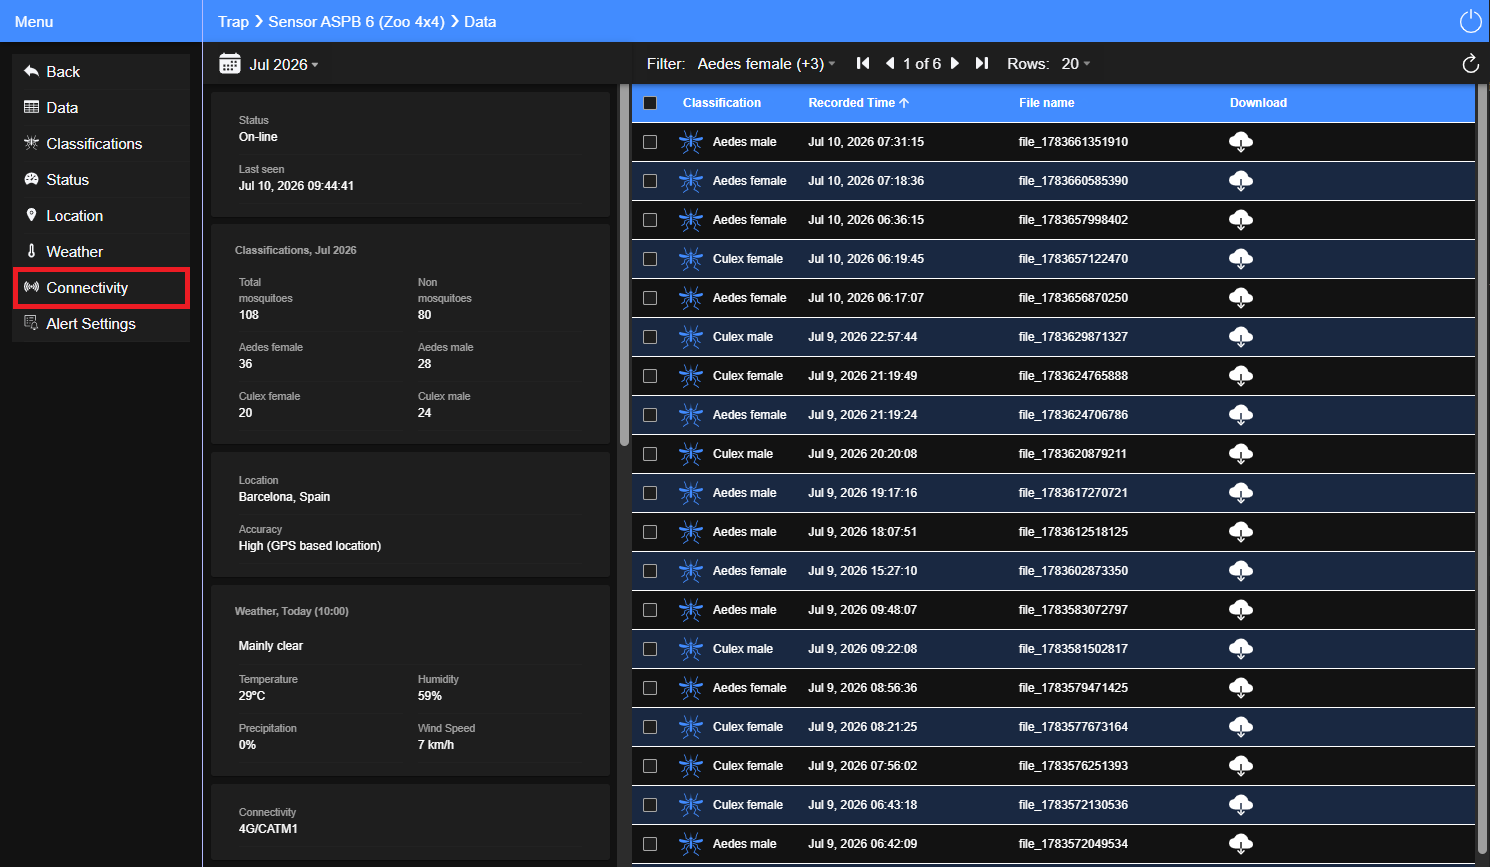
Main Components
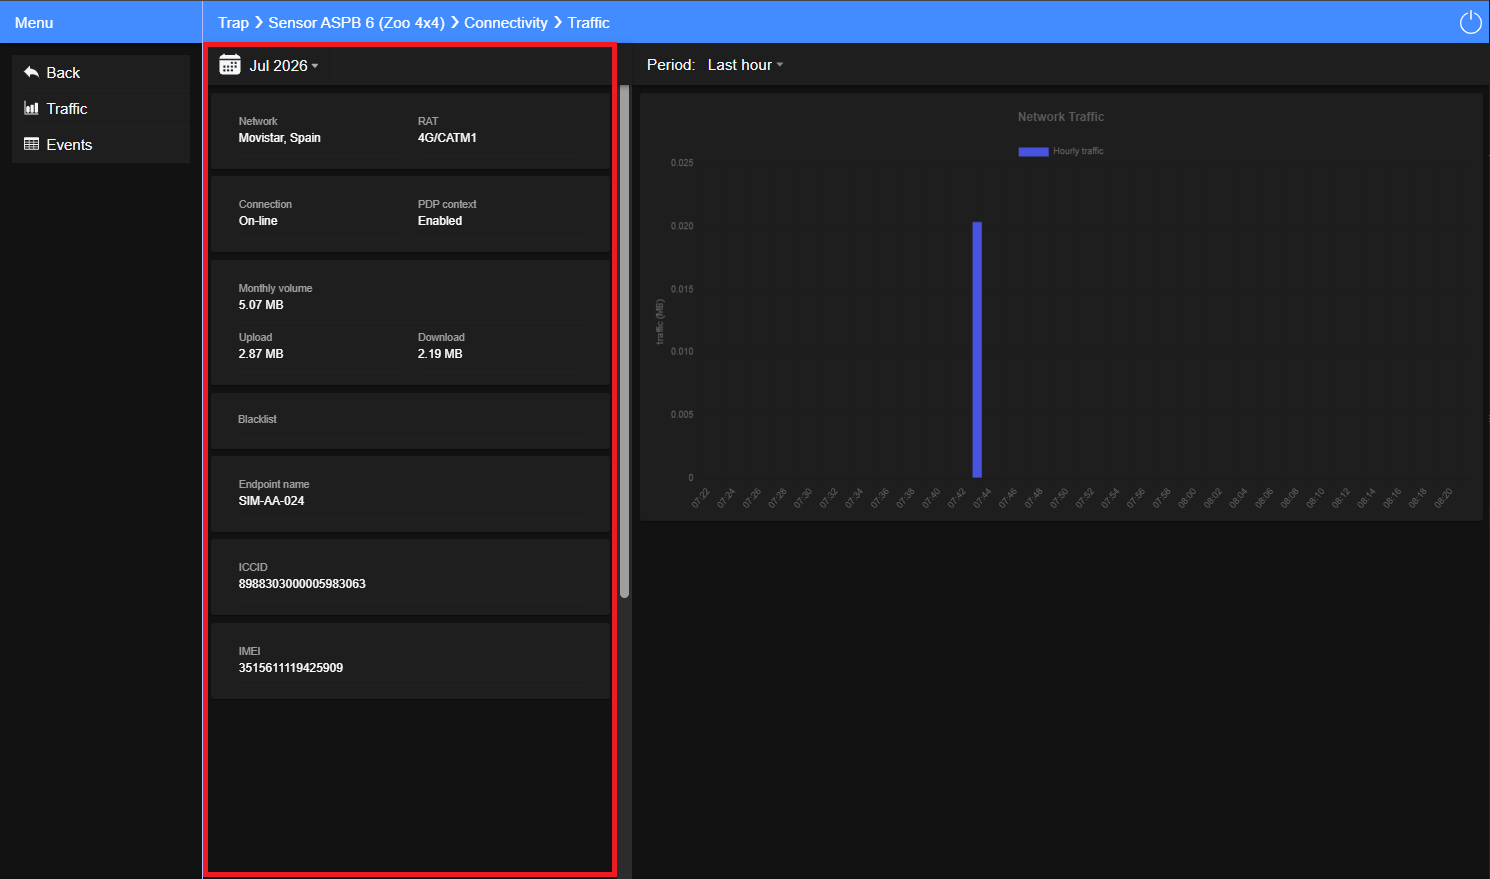
- Summary Panel: Displays the current network connection, mobile data usage, and SIM information for the selected sensor.
- Main Menu:
- Traffic: Displays mobile data usage using the Last Hour and Current Month views.
- Events: Displays a chronological log of network connectivity events for the currently selected reporting month, including informational and warning messages related to network connections, disconnections, and communication anomalies.
Summary Panel
Purpose
Provide an overview of the selected sensor's mobile network connection, SIM information, and mobile data usage.
Description
The Summary Panel is located on the left-hand side of the Connectivity Screen and provides key information about the selected sensor's mobile network connection and SIM configuration. It enables users to verify connectivity, identify the active mobile network and radio access technology, monitor monthly data usage, and retrieve device and SIM identifiers for diagnostics and support.
Key Components
- Reporting Period: Allows users to select the reporting month and navigate between months using the calendar controls.
- Network Operator: Displays the name of the mobile network operator currently providing service to the sensor.
- Radio Access Technology (RAT): Displays the current radio access technology used by the modem (for example, LTE, 4G, or 3G).
- Connection Status: Indicates whether the modem is currently Online or Offline.
- PDP Context: Indicates whether the modem's Packet Data Protocol (PDP) context is Enabled or Disabled, confirming whether a cellular data session is established and available for data transmission.
- Data Consumed (Current Month): Displays the total amount of mobile data transmitted by the sensor during the selected reporting month.
- Blacklisted Operators: Indicates whether any mobile network operators are included in the device or SIM blacklist.
- Endpoint Name: Displays the endpoint name configured for the sensor's mobile data connection.
- ICCID: Displays the Integrated Circuit Card Identifier (ICCID), the unique identifier assigned to the installed SIM card.
- Device IMEI: Displays the International Mobile Equipment Identity (IMEI), the unique identifier assigned to the modem installed in the sensor.
Changing the Reporting Period automatically refreshes all information displayed on the Connectivity Screen, including the Connectivity Panel, Traffic charts, and Events log, to reflect the selected reporting month.
Traffic Panel
Purpose
Visualize the mobile data usage of the selected sensor over recent and monthly reporting periods.
Description
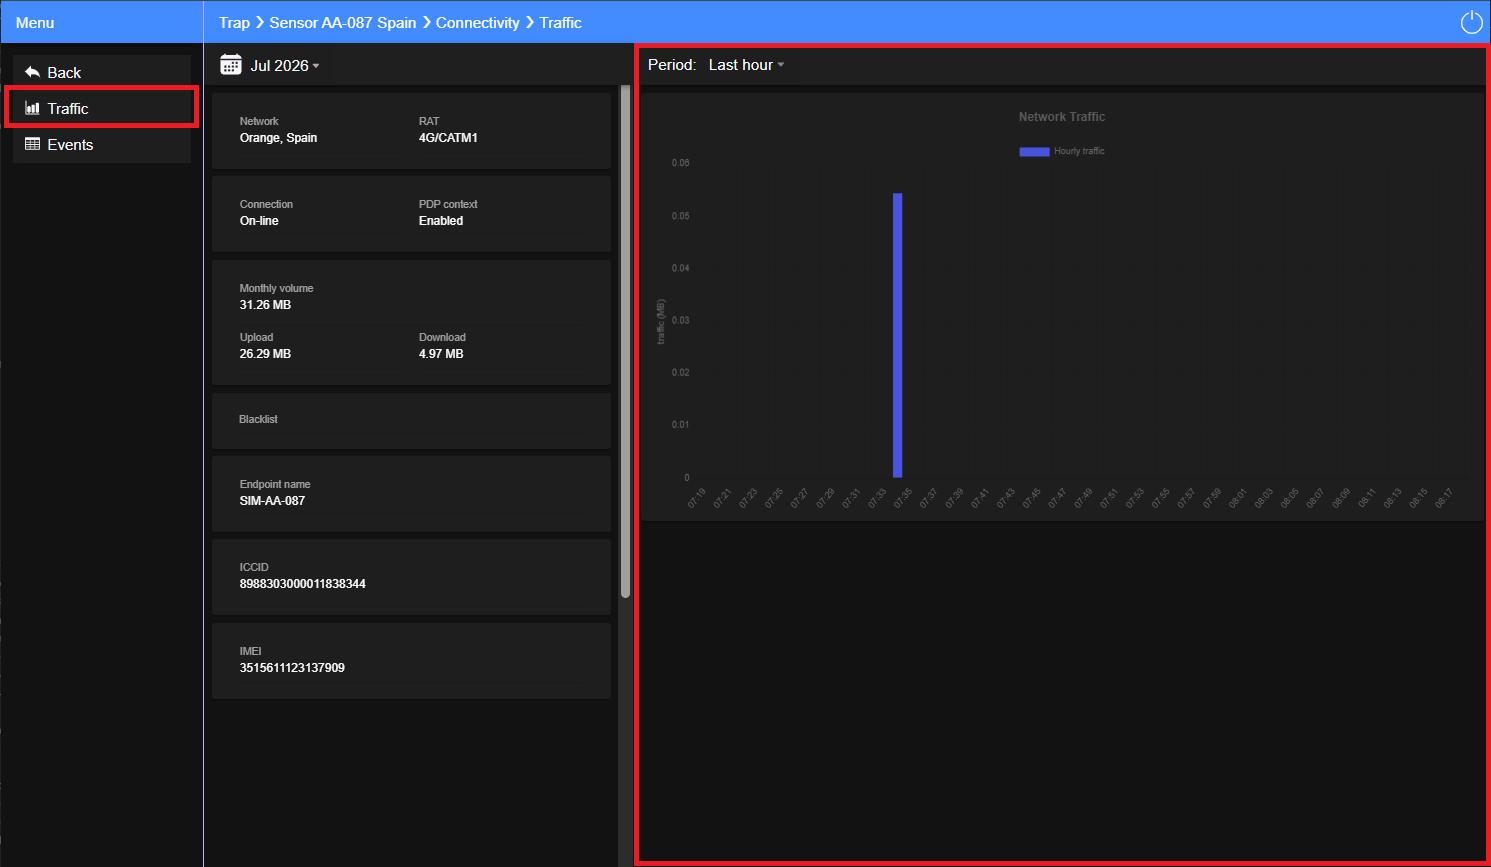
The Traffic Panel displays the sensor's mobile data usage using bar charts for two predefined views. It enables users to monitor recent communication activity during the Last Hour and review both daily and cumulative mobile data usage for the Current Month.
Access
From the Connectivity Screen, select Traffic from the Main Menu.
Key Components
- View Selector: Allows users to switch between the Last Hour and Current Month views.
- Last Hour Chart: Displays a bar chart showing the amount of mobile data transmitted during the previous hour, allowing users to monitor recent communication activity.
- Current Month Chart: Displays a combined bar chart showing:
- Daily Traffic: The amount of mobile data transmitted on each day of the current calendar month.
- Cumulative Traffic: The accumulated mobile data usage throughout the current calendar month.
Events Panel
Purpose
Provide a chronological record of the sensor's network connectivity events for diagnostic and troubleshooting purposes.
Description
The Events Panel displays a chronological log of connectivity events generated by the sensor's modem during the selected reporting month. It enables users to review connection activity, identify communication interruptions, and investigate network-related issues using both informational and warning event messages.
Access
From the Connectivity Screen, select Events from the Main Menu.
Key Components
- Severity: Indicates the severity level of each event, such as Information or Warning.
- Date: Displays the date and time at which the event occurred.
- Operator: Displays the mobile network operator associated with the event.
- Event Type: Identifies the modem operation or network event that was recorded, such as Create PDP Context or Delete PDP Context.
- Event Description: Provides a detailed description of the recorded event, including successful operations, assigned network parameters, or error messages when an operation fails.
The Events Panel records both normal modem activity and communication anomalies. Reviewing the event history can help diagnose intermittent connectivity issues, network registration failures, unexpected data session interruptions, and other network-related problems.